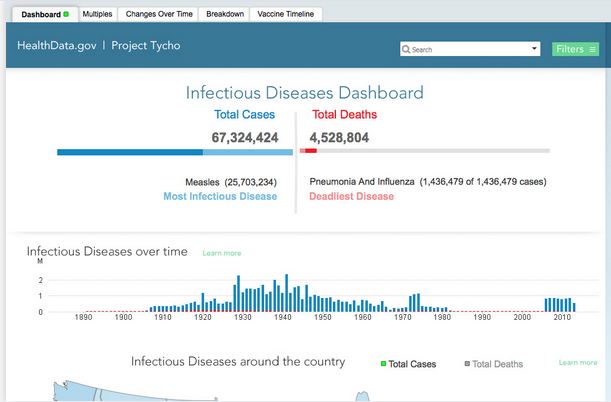
One of the QlikView’s primary differentiators is the associative user experience it delivers. QlikView is the leading
Business Discovery platform.
QlikView Real Features - To Make Visible Your Data, Highly Useful in Data Interpretation
It enables users to explore data, make discoveries, and uncover insights that enable them to solve business problems in new ways. Business users conduct searches and interact with dynamic dashboards and analytics from any device.
- Users can gain unexpected business insights because QlikView
- Works the way the mind works. With QlikView, users can navigate and interact with data any way they want to — they are not limited to just following predefined drill paths or using preconfigured dashboards. Users ask and answer questions on their own and in groups and teams, forging new paths to insight and decision.
- With QlikView, discovery is flexible. Business users can see hidden trends and make discoveries like with no other BI platform on the market.
Bar, Line, Combo, Radar, Scatter, Grid, Pie,
Funnel, Block and Gauge Chart as well as Pivot
Table and Straight Table.
-Charts you can find in QlikView
Search in QlikView
- Delivers direct — and indirect — search. With Google-like search, users type relevant words or phrases, in any order, and get instant, associative results.
- With a global search bar, users can search across the entire data set in an application. With search boxes affiliated with individual list boxes, users can confine the search to just that list box.
- They can both conduct direct and indirect searches.
- For example, if a user wanted to identify a sales rep but can’t remember the sales rep’s name — just details about the rep, such as that he sells fish to customers in the Nordic region — the user can search on the sales rep list box for “Nordic” and “fish” to get the names of sales reps who meet those criteria.
Next Steps:
Delivers answers as fast as users can think up questions
- A user can ask a question in QlikView in many different ways, such as lassoing data in charts and graphs and maps, clicking on items in list boxes, manipulating sliders, and selecting dates in calendars. Instantly, all the data in the entire application filters itself instantly around the user’s selections.
- The user can quickly and easily see relationships and find meaning in the data, for a quick path to insight.
- The user can continue to click on field values in the application, further filtering the data based on questions that come to mind.
- Illuminates the power of gray.
With QlikView, users can literally see relationships in the data
- They can see not just which data is associated with the user’s selections — they can just as easily see which data is not associated.
- How? The user’s selections are highlighted in green. Field values related to the user’s selection are highlighted in white. Unrelated data is highlighted in gray.
- For example, when a user clicks on a product category (say, bagels) and a region (e.g., Japan), QlikView instantly shows everything in the entire data set that is associated with these selections — as well as the data that is not associated. The result? New insights and unexpected discoveries.
- For example, the user might see that no bagels were sold in Japan in January or June, and begin an investigation into why.


.jpg)

Comments
Post a Comment
Thanks for your message. We will get back you.