I want to share with you how to use Python for your Data science or analytics Projects. Many programmers struggle to learn Data science because they do not know where to start. You can get hands-on if you start with a mini-project.
I have used Ubuntu Operating System for this project. You Need dual skills; Learning and Apply knowledge to become a data scientist. In Data science you need to learn and apply your knowledge.
After engineering, you can go for M Tech Degree.
You can become a real engineer if you apply engineering principles. So Data science also the same.
Data Visualization in Python is my simple project
Importance of Data
Data is a precious resource in resolving Machine Learning and Data Science Problems.
Define first what is your problem.
- Collect Data
- Wrangle the Data and Clean it.
- Visualize the Patterns
In the olden days, you might be studied a subject called Statistical Analysis.
In this subject, you need to study the actual problem and collect the data in a notebook.
Let us say when there were no computers in the olden days, people use paper and notebooks to collect and analyze data.
After that, they use pencil and graph paper and draw the charts based on selected data.
It is time consuming and laborious process. Finally based on the data visualization people correct the process.
The same concept you can see in current data science projects.
How to Write a Script in Python
Related Posts
Make sure These Steps Completed
- Install Ubuntu on a Virtual Machine
- Install Python 3.7X
- Install Anaconda Python - Which contains all the packages that you need for Data science projects.
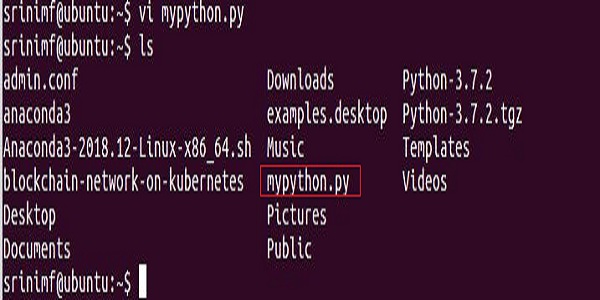
'ls' Command gives the Script I created for this Project

How to View Python Script using less command
5 Key Points to Remember
- Import command you can use to import packages.
- matplotlib is a package. This you need to draw a plot.
- Numpy is required to use all mathematical and scientific calculations. So I imported Numpy.
- The 'as' command is an alias. So that you can save a lot of coding time.
- I have drawn two plots. One is uniform and the other one in normal
Why I used if__name__=="__main__":The real meaning is that the script is running under the main().
Also the module mypython.py, you can run as Standalone or you can call this module using import command from another script.
In Python, you need to create modules using the .py extension.
Some people say as scripts and other people say as Modules.
All Python documents and Standard textbooks using the word
Python module. So you also can use it.
You May Also Like: Story of Python name and mainHow to Execute mypython.py in Python Console
$python mypython.py
Two Plots I have Drawn: Normal and Uniform Distribution
1). Normal Distribution
2). Uniform Distribution
Summary
Try today as this is a simple project. In realtime, a data analyst role is to deal with data and charts. I am sure you can begin your data analyst career with this project.


.jpg)
good information
ReplyDelete