Featured Post

How to Create a Symmetric Array in Python

Image
 Here's a Python program that says to write a Symmetric array transformation. A top interview question. Symmetric Array Transformation Problem: Write a Python function that transforms a given array into a symmetric array by mirroring it around its center. For example: Input: [1, 2, 3] Output: [1, 2, 3, 2, 1] Hints: Use slicing for the reverse part. Concatenate the original array with its mirrored part. Example def symmetric_array(arr):     """     Transforms the input array into a symmetric array by mirroring it around its center.     Parameters:     arr (list): The input array.     Returns:     list: The symmetric array.     """     # Mirror the array by concatenating the original with its reverse (excluding the last element to avoid duplication)     return arr + arr[-2::-1] # Example usage input_array = [1, 2, 3] symmetric_result = symmetric_array(input_array) print("Input Array:", input_arr...

10 Best Visualization Charts to Present data

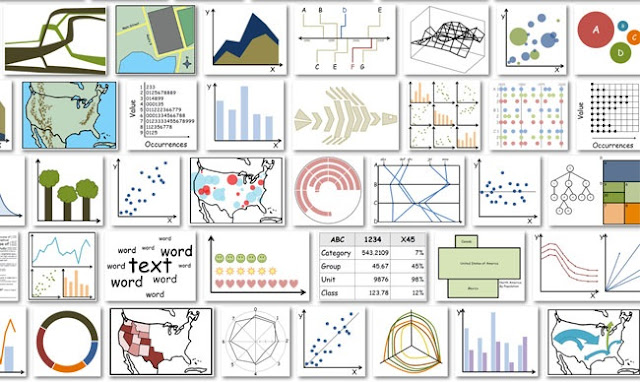
Here are the best data visualization chart examples. With these one can present the Data. So data visualization is the best way to do that. These charts help you understand the visualization concept quickly.


Data visualization
10 Best Visualization Charts to Present data


10 Visualization Charts With Examples.

  1. Pie charts
  2. Histograms
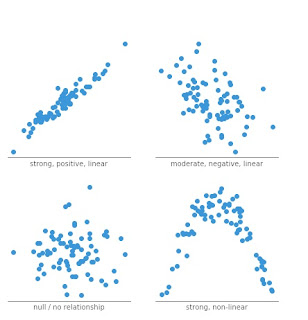
  3. Scatter plots
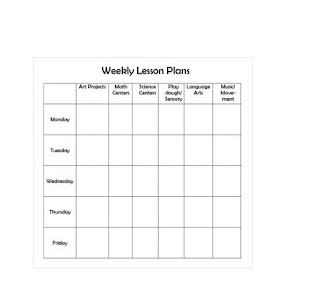
  4. Timetable charts
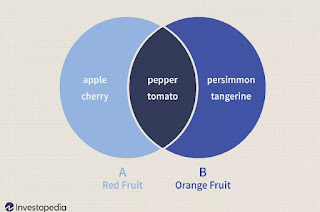
  5. Venn diagrams
  6. Steam graphs
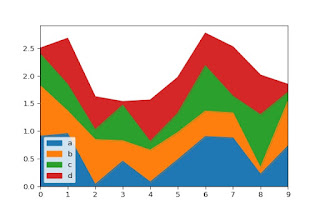
  7. Stacked area graphs
  8. Stacked bar graphs
  9. Parallel sets
  10. Multi-set bar charts

Pie Charts


Pie Charts


Best Example:

Histograms


Histogram


Best Example

Scatter Plots


Scatter Plots

Best Example:

Time Table Charts

Time Table Charts

Best Example
  • The best example is Schools, Colleges, and Offices.

Venn diagrams


Venn Diagram


Best Example

Steam graphs


Steam Graphs
Best Example:

  • The real usage of Steam charts in Engineering data analysis.

Stacked Area Graphs


Stacked area Graphs
Best Example:
  • The best example is A stacked area chart is best used when there are multiple lines of data. The raw values can be stacked, showing how the whole changes over time.
  • Stacked area chart example.

Parallel Sets


Parallel Sets


Best Example

Multiset Charts


Multi set Charts

Best Example

Comments

Popular posts from this blog

How to Fix datetime Import Error in Python Quickly

SQL Query: 3 Methods for Calculating Cumulative SUM

Big Data: Top Cloud Computing Interview Questions (1 of 4)