Posts

Showing posts with the label visualization charts

Featured Post

15 Python Tips : How to Write Code Effectively

Image
 Here are some Python tips to keep in mind that will help you write clean, efficient, and bug-free code.     Python Tips for Effective Coding 1. Code Readability and PEP 8  Always aim for clean and readable code by following PEP 8 guidelines.  Use meaningful variable names, avoid excessively long lines (stick to 79 characters), and organize imports properly. 2. Use List Comprehensions List comprehensions are concise and often faster than regular for-loops. Example: squares = [x**2 for x in range(10)] instead of creating an empty list and appending each square value. 3. Take Advantage of Python’s Built-in Libraries  Libraries like itertools, collections, math, and datetime provide powerful functions and data structures that can simplify your code.   For example, collections.Counter can quickly count elements in a list, and itertools.chain can flatten nested lists. 4. Use enumerate Instead of Range     When you need both the index and the value in a loop, enumerate is a more Pyth

10 Best Visualization Charts to Present data

Image
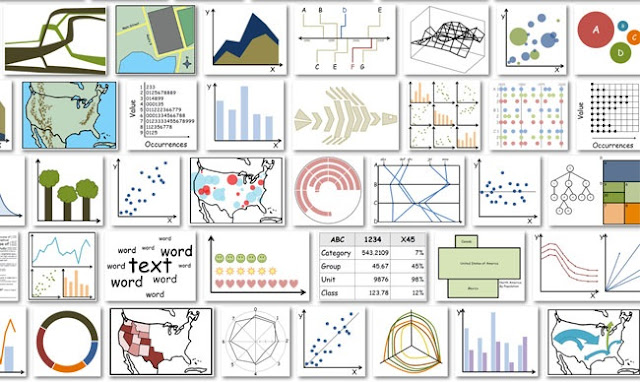
Here are the best data visualization chart examples. With these one can present the Data. So  data visualization is the best way to do that. These charts help you understand the visualization concept quickly. 10 Best Visualization Charts to Present data 10 Visualization Charts With Examples. Pie charts Histograms Scatter plots Timetable charts Venn diagrams Steam graphs Stacked area graphs Stacked bar graphs Parallel sets Multi-set bar charts Pie Charts Best Example: The real usage of Pie-charts is to find information about different groups. The complete data to draw Pie chart. Histograms Best Example The purpose of the Histogram is to know the frequency distribution. The complete data to draw Histogram Scatter Plots Best Example: The best example is to find the data scattering and to study the patterns. Useful in the study of medical data. The complete data to draw a Scatter plot. Time Table Charts Best Example The best example is Schools, Colleges, and Offices. Venn diagrams Best Ex